Tuesday 7 December 2010

Week 9 - Text

Just a short update this week - I'm slightly ahead of plan at the moment for the honours project, so I've been focusing more on my other courseworks. What I have done this week though, is implement some rendering of text on the screen, to display the Julian date and regular date. This is not as simple as it sounds in OpenGL!

The first thing I did however, was to increase the size of the objects. In the last blog there are some screenshots of the scalings I used - values like 0.005. I did this so I could zoom out far enough without the objects disappearing out of the matrix. I've done some experimenting with making the matrix larger though, and now the objects are scaled to a size easier to manage.

As a result I have implemented a seperate distance scale for the outer planets - this was done simply by adding another scalefactor variable. I'm not sure how I'm going to use these two seperate scales yet, but it's useful to have the option.

Finally, the main thing I've been working on is getting some text to display the Julian date. This should increase as the planets move around. I've also worked on converting the Julian date back into a regular (Gregorian) date format, and displaying that too.

The text strings that will be output are defined at the top of the DrawSolarSystem class. They're pretty simple, and look like this:


Now in order to render them on screen, a few things need to be done in the DrawGLScene method. Firstly, the view needs to be switched from perspective to orthographic, as the text is 2D, and won't be manipulated in 3D with the mouse controls etc. Then a for loop using the text string is defined to render the text. This looks like:


Drawing numbers that update, like the julian date and regular date, is a slightly different process, to start with anyway. Defined at the top of the DrawGLScene method, I used a function called gcvt to convert the numbered variables into strings, so that they can be displayed in the same way as the text strings. Here's the code:


Then, they are rendered to the screen much the same way as before. The example here is for the "year" number. Finally, the view is switched back to perspective.


And here is a screenshot of what the screen looks like:


Very fetching text I'm sure you'll agree! The Julian date updates nicely, although the more observant may notice that the julian date and regular date don't match. Only the year seems to be updating in the date. There seems to be a problem somewhere in the date calculations, but I'm not sure where yet. The program seems to be starting on the 2nd of December 2004, despite being coded to start on the 1st January 2004, so there's obviously a problem somewhere. I'll try and address this before next weeks blog.

That's all for this week. I've got lots of other coursework due in for next week, so I can't see next weeks blog being all that long either!

Monday 29 November 2010

Week 8 - Animation

This week I have been working on the DrawSolarSystem class. I've added quite a lot  - some initial keyboard functionality has been added (zoom, pan, rotate and pause), as well as mouse movement. This is in a very early form and I'm not happy with some elements, but it will do for now! The main focus of this weeks work was trying to implement the orbit of one sphere around another. I managed to implement this successfully, and went ahead to program the orbits for all the planets.

Another issue that was raised during my meeting with Rob was the slight difference in accuracy for my figures in the previous blog. I did some more research, and believe this is down to a difference in time. In the Utretch unversity page, they take 1st Jan 2000, 12 noon UTC as their start date. Their current date is 1st Jan 2004, 0:00 UTC. My program only calculates julian dates using day, month and year, where the time of day is as default 12 noon. This means theres a 12 hour difference between their current date and mine, which is I believe the reason for the slight difference in figures.

Firstly, I'd like to list major changes and additions to the classes.


  • the drawOrbit method in OrbitalCalculations has been changed to a type void, and thus doesn't return the planet's vector anymore. I've created a new method to return the vector, so it can be retrieved by the program without doing the whole drawing orbit calculation.
  • The Julian Date is defined as a variable julDate at the top of the DrawSolarSystem class now. This allows the julian date to have numbers added to it in order to increase the time.
  • Planets are created at the top of the DrawSolarSystem class as well, instead of in initGL, outside all methods. This is so different methods can use them.
  • For the same reason, instances of OrbitalCalculations are also created at the top of DrawSolarSystem.
  • Two new methods have been added to DrawSolarSystem for camera manipulation. One called camera, and one called mouseMovement.
  • A new method has been added to DrawSolarSystem to read in each model, so there are 9 methods of this type in total.
  • A new method has also been added to update every planets position, so there are 8 methods of this type.


Now I'm going to run through how the program reads in a model, puts it into a display list, draws that list then updates the planets position.

Firstly the model has to be read in. I use a seperate method for each model, simply to ensure each model is read in correctly. For now I am only using two models - suntest.obj, a yellow sphere, and planettest.obj, a red sphere. Both were created and exported from 3Ds Max. Here's the code to read in the sun model, the rest are much the same:


Next, the models are put into display lists in initGL. Putting the model into a display list means it can be scaled before being called by the drawing method, so it only happens once at the start of the program. As all the models read in are scaled to the same size to fit in the matrix, they have to be scaled again in order to maintain size difference. At the moment my figures are pure estimates, just done to give an impression of the size differences. Lights are also defined in initGL. At the minute, all I have is an ambient light. Here is the code to place the sun model into a display list (note: the scale is so small so that I can zoom greater distances, you'll see why I need to later!):


Now before I call the display list in myDrawGLScene, I need a method to update the position of the planet. Since myDrawGLScene is redrawn all the time, a loop is not required, as the update method will be called each time the scene is redrawn. So all I need to do is increase the julian day every call to the method, draw the orbit and translate the model by the x, y and z coordinates generated. Here is the method for mercury:


Now the display list can be called in myDrawGLScene when the model is drawn. Here is the code for the sun and mercury:


All this resulted in the following screen shots. The first image shows the Sun, Mercury,Venus and the Earth. The second is zoomed out slightly to include Mars. The third is zoomed out a lot to include Jupiter, Saturn, Uranus and Neptune. As you can see, the distances all look to be in proportion, with a lot of zooming out required to see Neptune! At the moment it looks a bit 2D, but thats due to the fixed angle and lack of lighting to give shade. Note that all planets are reading in the same test model, which is why they are all red.


Thats it for this week!

Monday 22 November 2010

Week 7 - More Programming

This week I have been working further upon the OrbitalCalculations class - namely, trying to prove that the figures being generated are correct by following through an example from a trustworthy source. The source I used was the following from Utrecht University - http://www.astro.uu.nl/~strous/AA/en/reken/hemelpositie. In getting this result, I have edited the class quite a bit, and will detail those changes later. I have also worked on getting a proper import code, that will allow my program to read in 3Ds max models and their materials.

Firstly, the changes to the orbital calculations class;

  • getV has been replaced with getTrueAnomaly, and the variables likewise - so double v is now double trueAnomaly. This was mainly to help myself, I had not realised initially that the variable v that I was calculating was the true anomaly. I also changed the code, to give a more accurate result. I adapted the code from the same resource as the eccentric anomaly code - http://www.jgiesen.de/kepler/kepler.html.
  • variable perihelionTime has been removed. After discussions with Rob it became clear that the current method of calculating the mean anomaly could not work, as there was very little to no data available on the date of perihelion passage for any planet other than Earth. The new method requires a start time which the orbital elements are valid for (01/01/2000) and the current date.
  • Using the method of calculation detailed in the Utrecht University website, it is no longer necessary to calculate the X,Y,Z values in two parts, so x1, y1, z1, x2, y2, z2 and their associated methods have been removed and merged into one for calculating x, y and z on their own.

Now onto the big problem I had in getting the numbers my program output to equal the ones that website said I should be getting - radians and degrees. You see, the computer computes sin/cos/tan functions in radians, and the data I input and want output is in degrees. This gave me quite some trouble, but essentially each variable which is an angle had to be converted into radians before the calculation is carried out, then converted back into degrees if it is returning an angle. What I did was create a variable called k, and make it equal to Pi / 180. This means that multiplying an angle by k will convert it from degrees to radians, and dividing an angle by k will convert an angle from radians to degrees.

I'd like to run through the example on the Utrecht University website for calculating the X,Y,Z position of Jupiter. 

The first step is to calculate the mean anomaly. Here is a screenshot of my new mean anomaly calculation:


The UU website states the result should be: 141.324°

Next, the true anomaly. Here's my new code to calculate the true anomaly:

The result for the true anomaly should be: 144.637°

Next up, the distance to the sun, which is r. My code to calculate r hasn't changed actually, but I did have to convert the true anomaly used in the calculation into radians first.

The result for r should be: 5.40406 AU

Finally, the x,y,z coordinates. I'll post an image of my code to calculate X, the other two are similar. Notice that each angle has to be multiplied by k - this is not shown on the website, and gave me lots of trouble!


The x,y,z coordinates for Jupiter should be: −5.04289, 1.93965, 0.10478

Now, here's a screenshot of my results:


and a side by side comparison. Target results in red, my results in blue.

Mean Anomaly: 141.324° | 141.365°
True Anomaly: 144.637° | 144.036°
r: 5.40406 | 5.40417
x: −5.04289 | -5.04431
y: 1.93965 | 1.93624
z: 0.10478 | 0.104829

Pretty close! I'm very happy with how the calculations are working. 

The second part of what I was working on this week was importing a basic model from 3Ds Max and getting it displayed on screen. This proved quite difficult! The code I was planning to use from last semester proved instantly unusable - it requires models to be of .txt format, and 3Ds Max does not export to this format.

I spent many hours trying and testing different loaders, and eventually settled on an object loader (it loads models of type .obj) called GLM from this website: http://www.3dcodingtutorial.com/Working-with-3D-models/Getting-GLM.html. I imported the files into my project and put them in a seperate folder - this means that the ImportModel and point classes I had made are no longer needed. 

With a bit of tweaking, I've managed to get a geosphere with a material of an alien's face that I created in 3Ds Max, to display in my viewport window. Here's a screenshot:


All in all, some good progress made. 

More next week.

Saturday 13 November 2010

Week 6 - Initial Coding - Orbital Calculations

Coding has begun! This week I have set up the initial class framework in visual studio (I have switched to visual studio 2008 as this is what is used in the University labs, in case anything happens to my laptop), and begun programming the orbital calculations class.

Firstly I'd like to mention some initial problems I have come across and what I have done to fix them, and changes I have had to make to the UML plan.

In the CreatePlanet class, i have added longitudeAscendingNode and longitudePerihelion as private instance variables (doubles). This was an oversight, as these values are required in the calculations for x1, y1 and z1. I have also removed periodOfOrbit as a variable in CreatePlanet, and moved it to the OrbitalCalculations class. I found it was easier to calculate the period of orbit using the semi-major axis, instead of hard code in a value for each planet.

The bulk of changes has occured in the OrbitalCalculations class. Firstly, meanAnomaly has been added as a private instance variable. I'm not sure why I left this out, but the variable is required to calculate the mean anomaly in the drawOrbit method. Secondly, I found I had neglected to consider the need of parameters in the majority of the methods. This was a mistake as of course most of the calculations utilise data which will, in the end, be taken from the created planets. These changes are as follows:


As you can see from the image, I have also renamed the vector class to Vector3D. I was a bit worried about vector being a reserved C++ word, so changed it to be on the safe side. Another change is to make the drawOrbit method Vector3D, instead of void. This simply means that the method returns the coordinates in vector form, instead of having another method to do this.

One of the major issues I knew I would have is calculating the eccentric anomaly. I tried out a few iteration methods that didn't work, but managed to find C# iteration code on this website: http://www.jgiesen.de/kepler/kepler.html. I adapated this code into C++, and tested it to give the same results as the calculator on that website. A screenshot of this method is below:


The final drawOrbit method utilises all the previous methods in the class to calculate the final x,y,z coordinates, here is a screenshot of this method:


I have also included test printing in this method, which will print the various stages to the console when the method is called in DrawSolarSystem. I had an issue with printf, the printing mechanism I have previously used in C++, and so decided to use cout as my test printing method throughout the program.

I had one final major oversight at this stage, which became apparent when I went to create the planet and test the drawOrbit method in DrawSolarSystem. The mean anomaly calculation requires a current time and a time since the planet was last at the perihelion point to be defined - what format was that in? I hadn't previously considered this fully. With some research, I discovered that astronomers use the Julian dating system (defintion), and thus my program would have to have some system of converting standard (Gregorian) dates into Julian dates. What I did was to add another class, called DateTime. In this class a date with a year, month and day can be defined, then a method called to convert it into a Julian date. It also has a method to convert a Julian date back into a Gregorian date, should it be necessary. The calculations for these methods were adapted from the following website: http://www.usno.navy.mil/USNO/astronomical-applications/astronomical-information-center/julian-date-form. I also used this website which calculates Julian dates to confirm that the method works correcetly. A screenshot of the class is below:


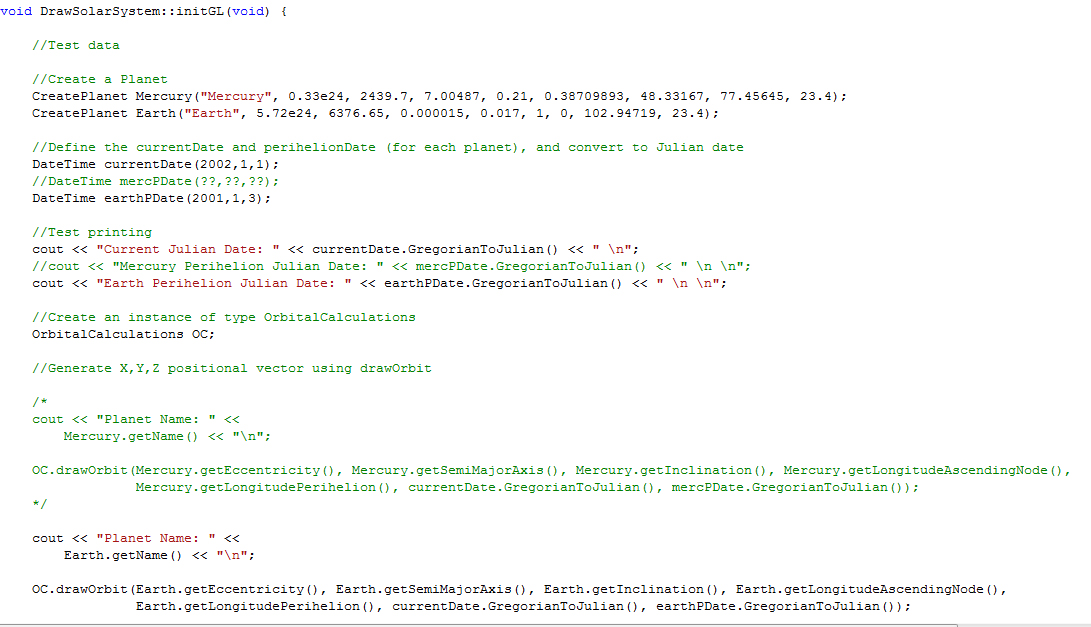
Now i was able to create a planet in the InitGL class of DrawSolarSytem, and call the drawOrbit method of OrbitalCalculations in order to check the test prints. Here are some screenshots of the method, and the resultant console print out:


As you can see, data is given out for each calculation, so it's definately doing something!

Now onto the unresolved problems. As of yet, I haven't been able to find any data to verify and compare the majority of my answers with, aside from the Julian date and obvious ones like period of orbit.

In addition, you may have noticed commented out code to test Mercury as well as the Earth. I've searched for quite some time today trying to find dates for when Mercury was at it's perihelion point, but have so far been unable to find any data. This was easily sourcable data for the Earth, but appears much harder to find for other planets, and is something I will be consulting my supervisor about.

That's pretty much it for this week, some useful links I've found and used this week to follow.

Useful Links:

Perihelion dates for the Earth - dates for when the Earth was/will be at it's perihelion point. Would be lovely to have a similar table for other planets!

http://www.met.reading.ac.uk/~ross/Documents/OrbitNotes.pdf - contains slightly different orbital elements data than the JPL source I have been using. Something to discuss with Rob?

http://www.devmaster.net/forums/showthread.php?t=5059 - How to load 3Ds max objects into OpenGL. Could be useful if my current method fails.

Tuesday 9 November 2010

Blog Week 5 - More Design

This week I have been focusing on producing a UML diagram showing my ideas for class content and class interaction. I've also made a short storyboard, showing how I envisage the final user interface to look.

Firstly, the UML diagram (click to expand):


As you can see, there are 7 classes; main, vector, point, ImportModel, CreatePlanet, OrbitalCalculations and DrawSolarSystem.

The main class just initialises OpenGL and creates the window that the program will run in. Vector and Point are simple classes - the models imported will be constructed of type point, and the X,Y,Z coordinates generated will be of type vector. The ImportModel class will allow 3Ds Max models to be imported and drawn in the program using OpenGL. At the moment I am intending to use the same import code as I used in an OpenGL module last semester, although I am not entirely sure if this will work - I will address this problem if it arises.

The CreatePlanet class creates an object with all the required planetary information needed for the orbital calculations - such as the eccentricity, semi-major axis value and the period of orbit. The UML diagram indicates that the planets would be created in the OrbitalCalculations class, but this is something I am unsure of at the moment. It may be better to create them in the DrawSolarSystem class.

The OrbitalCalculations class contains all the necessary calculations to generate the X,Y,Z coordinates needed. As time updates, so do these coordinates, and thus the planets orbit is drawn. The key method here is the drawOrbit method - this requires the current time and the time that the Planet was last at the point of perihelion (the closest point on a planet's orbit to the Sun) to be passed down to it when it is called. This means that if this function is placed in a for loop when it is called in DrawSolarSystem, with the currentTime increasing every loop, the planet should move in the correct orbit.

Finally the DrawSolarSystem class is where the actual drawing to the user inteface takes place. This is where the models will be imported and positioned, as well as all the user interface features such as zoom and speed up will be implemented.

I have made some simple storyboards to show how I see the user interface taking shape (click to expand):


That's pretty much it for this week. Hopefully next week I will be able to make a start on coding!

Interesting Link:

http://www.jgiesen.de/kepler/kepler.html - contains a JavaScript calculator to calculate the eccentric anomaly, as well as the true anomaly. Also gives the code for this calculator.

Tuesday 2 November 2010

Blog Week 4 - Design

This week and next will have been spent doing design work for the project. I intend to complete a Mind Map, UML Diagram and Storyboard in this process.

Unfortunately I have been ill over the past week so have not been able to complete these tasks yet. I have finished the mind map, which I will post up, and have made progress on the UML. I intend to complete the UML diagram and Storyboad by the end of next week.

Here is the mind map. It details design methods, initial class ideas and user interface ideas (click to expand):

Saturday 23 October 2010

Blog Week 3 - Orbital Elements and Project Spec

This weeks blog will be relatively short, as I will also be writing a Project Specification, which is due in a week today. Here is an overview of what it will contain:

  •   The project specification is a more detailed description of the work to be done. Two sides of A4 should suffice. 
  • This should document the initial avenue of research / development which the student follows; indicate any prototype developments which are envisaged; suggest comparative studies of different design approaches etc. The initial project plan should be drawn up after a preliminary investigation of the literature. 
  • This deliverable is not formally marked, but it will inform the supervisor’s assessment of conduct. Failure to submit on time (without good reason) will have a negative effect on the conduct grade.

Following my supervisor meeting this week, it became clear that I was looking in the wrong area for the equations I needed to calculate an orbit. What I needed were Orbital Elements. These are 6 elements, some detailed in the diagram below, from this website


The actual 6 orbital elements are:

Eccentricity (e)
Semimajor Axis (a)
Inclination (i)
Longitude of the ascending node (Ω)
Argument of periapsis (\omega\,\!)
Mean anomaly (M)

First, a couple of equations are needed to calculate the planets polar coordinates, (r, v). Kepler's equation allows us to solve the Eccentric anomaly, once we have calculated the Mean anomaly. The two equations are shown below:


Once E has been calculated, r and v can be:


I can make use of this data to calculate the Heliocentric Ecliptic coordinates (x,y,z) for a planet, which are an X,Y,Z coordinate system centered on the Sun in which the ecliptic lies in the X-Y plane. The equations to calculate these points are:


Now, what I really need are the Heliocentric Equatorial coordinates (X,Y,Z) for a planet, in which the coordinate system centred on the Sun with the Sun's equator lying on the X-Y plane - the type I will base my system around. The equations to calculate these points are:


Onto the most important part of the blog - this data is confirmed in a PDF document on the JPL Solar System Dynamics website (a NASA source). The PDF also lists the Keplerian Elements for the time period 1800 AD - 2050 AD, an invaluable resource for me to be able to calculate the planetary orbits for this project. It should be noted that the website states that the data for these positions is only approximate, but it should be efficient enough for this project.

Friday 15 October 2010

Blog Week 2 - Orbits

This week I'm focusing on finding out more information about planetary orbits. Firstly I'd like to recap on some of the thoughts in the previous blog following this weeks meeting with Rob Lothian (my project supervisor);

  • Planetary bodies - due to the complex nature of getting the actual planets to orbit, creating different orbits for moons may be too much for this project. I think I'd like to include moons - at the very least for the Earth - but this is something that will need to be considered later in the project.
  • A third scale may be required for the Sun (the first being distance between the planets, and the second the size of the planets in relation to each other). This is however something that can be looked at and played around with once the basic orbital coding is done.
  • Selecting a starting date for the program will just be done using accurate data, not using any "planetary alignments", so to speak.

Now, on to this weeks work. Following the honours project talk we had midweek, I've starting producing a Mind Map. Hopefully mainting this and the blog will prove extremely useful when it comes to writing up the final report for this project.

For this weeks research on orbits, I have been using a variety of websites - applet-magic states that a planets orbit is calculated by the balance between the gravitational attraction between the planet and the Sun, and the centrefugal force from it's movement in a approximately circular orbit.
The site details that in order to calculate a planets orbit, five main points - called Lagrangian points - are needed. It goes on to explain the math behind this, although it doesn't appear to be finished. To be honest, the math goes right over my head, and it's very difficult to understand.
On the same website - http://www.applet-magic.com/orbital.htm - they have a table of orbital velocities which also includes information on the length of a year and the orbital radii of the planets, in relation to the Earth.

One important point to note about orbits is that they are not circular, they are elliptical, and each planet has an eccentricity value between 0 and 1 - the close to 0, the more circular the orbit, the closer to 1, the more flat.
I found a useful table documenting these values for 6 of the 8 planets:

Planet $e$
Mercury 0.206
Venus 0.007
Earth 0.017
Mars 0.093
Jupiter 0.048
Saturn 0.056


Upon further study, perhaps a better way to calculate the orbit of the planets would be to use Kepler's Law's of Planetary Motion. These are (from istp.gsfc website):

  1. Planets move around the Sun in ellipses, with the Sun at one focus
  2. The line connecting the Sun to a planet sweeps equal areas in equal times.
  3. The square of the orbital period of a planet is proportional to the cube (3rd power) of the mean distance from the Sun (or in other words--of the"semi-major axis" of the ellipse, half the sum of smallest and greatest distance from the Sun). Shown below (from this website):

The astro-tom website explains how Kepler's third law can be used to calculate the orbits of other planets, given certain data. The equation used is;

P (years)2 = R (A.U.s)3


Where P is the period of the planets (measured in Earth years), and R is the length of the semi major axis of the planet's orbit (measured in an astronomical unit, the average seperation of the Earth from the Sun).
The website demonstrates how the semi-major axis length of Mars can be calculated given it's orbital period.

On the istp.gsfc website, an alternate equation is given:

r = a(1 – e2)/(1 + e cos f)
 

Where a is the length of the planet's semi major axis, e is the eccentricity value and the polar coordinates are (r,f).

Overall, I'm pretty confused about which equations I should be using, and even how to implement them, so this is definately something I will need to discuss with Rob.

Interesting links

http://dunnbypaul.net/ssdisckit/ -  a complex digital orrery. Contains useful references.

http://cfa165.harvard.edu/software/catalogs/sao.html - Star catalog, lots of information on many stars.

http://www.exploratorium.edu/ronh/solar_system/ - Scaling calculator - calculates planet sizes and orbits given a scaled size of Sun. Contains a link to given scaled sizes of moons and various other satellites too.

http://www.burtleburtle.net/bob/physics/solar.html#ref - small digital orrery, lots of useful references

Planet Textures

Whilst researching orbits this week, I also stumbled across some great websites which contain free to use textures of all the planets, and in some cases a few moons also. These resources will be incredibly useful for the planets aesthetics when it comes to modelling the planets in 3Ds Max. I've published this as a seperate blog so it's easier to find when the time comes for me to do the modelling.

http://planetpixelemporium.com/ - texture maps for all the planets and some moons, 1k versions for free. Also contains some tutorials.

http://www.mmedia.is/~bjj/planetary_maps.html - lots of texture maps, plus detailed information about each map.

http://maps.jpl.nasa.gov/ - database of texture maps, including some of high quality available for free.

Sunday 10 October 2010

Blog Week 1 - Direction

The first decision that I need to make in undertaking this project is which direction I would like to take the project in.

The coding language I have settled on is C++. Programming in this language means I can interact with OpenGL far easier than I could in other languages, such as Java. The orrery program should allow the user to view the planets orbiting the Sun initially from the furthest point out, with the option to zoom and view the other planets. Intial timescale should relate to a day passing every second, but the user will have the option to increase this in order to see the planets orbit at a higher speed. 

I am unsure yet as to how many moons I will include in this program. Initially I had thought to include only moons with a radius greater than 1000km - this gives me 16 planetary bodies in the system:
  • The Sun
  • Mercury
  • Venus
  • The Earth
    • The Moon 
  •  Mars
  • Jupiter
    • Io
    • Europa
    • Ganymede
    • Callisto
  • Saturn
    • Titan
  • Uranus
  • Neptune
    • Triton
This means that none of Mars' or Uranus' moons and only one of Saturn's and Neptune's would be included. This is something I will need to discuss further with my supervisor before making a cast iron decision. I do not think that the dwarf planets (such as Pluto) will be included, but as I say this is something I need to discuss and return to.


The following is a list of programs that I intend to use during this project:
  • Microsoft Visual Studio 2010 - for C++ programming
  • Autodesk 3Ds Max 2011 - for modelling of planets etc
  • Microsoft Word 2010 - any necessary word processing
  • Adobe Photoshop CS5 - texture editing etc


I will be using this blog to keep track of any links with useful information that I feel may prove useful in the future of the project. Here are a few that I have come across during my intial research this week:

http://nineplanets.org/ - comprehensive information site on the eight planets (despite the name), their moon, dwarf planets, and various other small bodies in the solar system.


http://star.arm.ac.uk/~dja/planets.html - orbital positions of the planets, dating from January 2000 to projected positons in December 2019.

http://www.etsu.edu/physics/etsuobs/starprty/22099dgl/planalign.htm - information on Planetary aligments. I had initially thought that a "planetary alignment" would make a perfect starting time for the program, yet this seems more complex than I had first realised.

http://www.easytorecall.co.uk/orrery_simulation.htm - A very basic Javascript 2D digital orrery. Shows orbits of Mercury, Venus, Earth and Mars and their moons around the Sun.

http://www.gifford.co.uk/~principia/orrery.htm - Another very simple digital orrery. Shows all planetary orbits, but no moons. Also shows current position of planets.

Welcome

Welcome to my honours project blog.

This blog should contain weekly updates, detailing what I've worked on in the current week. I'll also post any links to interesting information or good websites that I've used to aid my development of this project.

The project I have chosen to do is to produce a digital orrery. An orrery is a mechanical device which demonstrates the planetary postions (with their moons) and orbits in the the solar system, an example is below:

 
My task is to reproduce this in a digital form on a computer.

Update on this weeks work coming up!