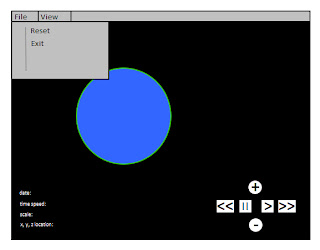
This week I have been focusing on producing a UML diagram showing my ideas for class content and class interaction. I've also made a short storyboard, showing how I envisage the final user interface to look.
Firstly, the UML diagram (click to expand):
As you can see, there are 7 classes; main, vector, point, ImportModel, CreatePlanet, OrbitalCalculations and DrawSolarSystem.
The main class just initialises OpenGL and creates the window that the program will run in. Vector and Point are simple classes - the models imported will be constructed of type point, and the X,Y,Z coordinates generated will be of type vector. The ImportModel class will allow 3Ds Max models to be imported and drawn in the program using OpenGL. At the moment I am intending to use the same import code as I used in an OpenGL module last semester, although I am not entirely sure if this will work - I will address this problem if it arises.
The CreatePlanet class creates an object with all the required planetary information needed for the orbital calculations - such as the eccentricity, semi-major axis value and the period of orbit. The UML diagram indicates that the planets would be created in the OrbitalCalculations class, but this is something I am unsure of at the moment. It may be better to create them in the DrawSolarSystem class.
The OrbitalCalculations class contains all the necessary calculations to generate the X,Y,Z coordinates needed. As time updates, so do these coordinates, and thus the planets orbit is drawn. The key method here is the drawOrbit method - this requires the current time and the time that the Planet was last at the point of perihelion (the closest point on a planet's orbit to the Sun) to be passed down to it when it is called. This means that if this function is placed in a for loop when it is called in DrawSolarSystem, with the currentTime increasing every loop, the planet should move in the correct orbit.
Finally the DrawSolarSystem class is where the actual drawing to the user inteface takes place. This is where the models will be imported and positioned, as well as all the user interface features such as zoom and speed up will be implemented.
I have made some simple storyboards to show how I see the user interface taking shape (click to expand):
That's pretty much it for this week. Hopefully next week I will be able to make a start on coding!
Interesting Link:
http://www.jgiesen.de/kepler/kepler.html - contains a JavaScript calculator to calculate the eccentric anomaly, as well as the true anomaly. Also gives the code for this calculator.


No comments:
Post a Comment