Showing posts with label Jupiter. Show all posts

Thursday, 3 March 2011

Week 23 Continued - Planet View images

Please check the previous blog for a technical summary of this weeks work!

Here are some images of the planet views that I implemented this week, and a final program shot. Click to expand images. The Saturn view is my favourite, be sure to check them all out!

Shot of the final program, defualt planet sizes and distances (they're hard to spot!)

Shot of the final program, expanded model sizes and distances decreased

Mercury, default size

Mercury, largest size

Venus, default size

Venus, largest size

Earth, default size

Earth, largest size

 
Mars, default size

Mars, largest size

Jupiter, default size

Saturn, default size

Saturn, largest size

Uranus, default size

Neptune, default size


Sunday, 9 January 2011

Week 15 - Planet Models and Sky Box

My last major update was some weeks ago, detailing the completion of text on the screen. This that point, the program has progressing significantly - most of all aesthetically.

The first problem in the programs looks I wanted to solve was how to get a starry background in place - this adds greatly to the realism of the program. I decided that the best method would be to create a sky box - essentially a large box around the camera with edges that blend into each other, so it looks like a continuous background every way you look.

This proved to be more difficult that I had anticipated. In the end, I used sky box tutorial code, found here, and edited the size of the box and the images to be displayed myself. Another problem risen by this was the use of the GLaux library - which has been discontinued. This is mainly used in the loading of the BMP image for each side of the box. I had to implement replacement code, which I found here.

Initially, I used a really hi res star map I found using google images - this can be seen in the background for the program two blogs ago, showing the Earth. I replaced this with a star map found on the NASA website - namely, the Hipparcos star map. The stars are really colourful, and I used the original colouring at first - but found it was too hard to spot some of the smaller planets like Mercury in the program, because they looked like one of the stars in the map! So I greyscaled the image and used that as my background. Because the scene has to look continuous, every side of the sky box uses the same image.

In my project plan I had specified that I had hoped for planet modelling and loading into the program to be completed by this week, week 15 - and that is the other main part I have managed to complete this week. You can see the renders for each model in the previous blog. The models unfortunately cannot look that good in the program, but I think they still look pretty nice. Another big change from the previous blog is that I have fixed the lighting - in my excitement at getting the models into the program and working, I had not noticed that the lightning was no longer affecting them. In fact, I had forgot to turn on GL lightning in the myDrawGLScene class! I placed this call after the Sun model is draw - this way, shadows don't affect the Sun model so it appears to be a light source.

The final change I made was to make the model scales more realistic - previously, they were very rough estimates by myself, just to give an idea. I used the size calculator at this website, with the largest planet having a scale value of 1.21 - Jupiter (actually saturns is larger, but this is because the model is loaded in a lot smaller due to the rings). If the Sun was draw to scale, it would have a value of 11 - this is too large realistically for my model, so it is currently at a value of 2 (although I may change this).

Finally for this week, a screenshot of the program, again seen from Jupiter. As you can see, the lighting has made quite a difference to the quality of the model:


The inner four planets have all taken a size decrease, whilst Jupiter has actually got slightly bigger than I orginally had it. You can make out The Earth, Venus and Mercury in various states of orbit in the above image, as well as Mars (red dot some way above Venus, quite hard to spot!).

That's all for this week. The next major update will probably not be till the start of the new semester, due to exams.

Wednesday, 5 January 2011

More Models + Program shot

Another quick update today, I finished all the 3Ds Max models and here are some screenshots of the renders. Remember and click to expand the images.

The Sun


Mercury


Venus


Mars

Jupiter

Saturn

Uranus


Neptune


And finally, a shot of the program, from the perspective of Jupiter looking towards the Sun. You can see the inner four planets - Mars (top right), Earth and Venus (above the Sun) and Mercury (small dot below the Sun). I've also decided to use a different star image in my skybox, as the last one seemed a little busy and hurt the eyes - I think this one looks better.


Full technical update still to come at the end of the week.

Monday, 22 November 2010

Week 7 - More Programming

This week I have been working further upon the OrbitalCalculations class - namely, trying to prove that the figures being generated are correct by following through an example from a trustworthy source. The source I used was the following from Utrecht University - http://www.astro.uu.nl/~strous/AA/en/reken/hemelpositie. In getting this result, I have edited the class quite a bit, and will detail those changes later. I have also worked on getting a proper import code, that will allow my program to read in 3Ds max models and their materials.

Firstly, the changes to the orbital calculations class;

  • getV has been replaced with getTrueAnomaly, and the variables likewise - so double v is now double trueAnomaly. This was mainly to help myself, I had not realised initially that the variable v that I was calculating was the true anomaly. I also changed the code, to give a more accurate result. I adapted the code from the same resource as the eccentric anomaly code - http://www.jgiesen.de/kepler/kepler.html.
  • variable perihelionTime has been removed. After discussions with Rob it became clear that the current method of calculating the mean anomaly could not work, as there was very little to no data available on the date of perihelion passage for any planet other than Earth. The new method requires a start time which the orbital elements are valid for (01/01/2000) and the current date.
  • Using the method of calculation detailed in the Utrecht University website, it is no longer necessary to calculate the X,Y,Z values in two parts, so x1, y1, z1, x2, y2, z2 and their associated methods have been removed and merged into one for calculating x, y and z on their own.

Now onto the big problem I had in getting the numbers my program output to equal the ones that website said I should be getting - radians and degrees. You see, the computer computes sin/cos/tan functions in radians, and the data I input and want output is in degrees. This gave me quite some trouble, but essentially each variable which is an angle had to be converted into radians before the calculation is carried out, then converted back into degrees if it is returning an angle. What I did was create a variable called k, and make it equal to Pi / 180. This means that multiplying an angle by k will convert it from degrees to radians, and dividing an angle by k will convert an angle from radians to degrees.

I'd like to run through the example on the Utrecht University website for calculating the X,Y,Z position of Jupiter. 

The first step is to calculate the mean anomaly. Here is a screenshot of my new mean anomaly calculation:


The UU website states the result should be: 141.324°

Next, the true anomaly. Here's my new code to calculate the true anomaly:

The result for the true anomaly should be: 144.637°

Next up, the distance to the sun, which is r. My code to calculate r hasn't changed actually, but I did have to convert the true anomaly used in the calculation into radians first.

The result for r should be: 5.40406 AU

Finally, the x,y,z coordinates. I'll post an image of my code to calculate X, the other two are similar. Notice that each angle has to be multiplied by k - this is not shown on the website, and gave me lots of trouble!


The x,y,z coordinates for Jupiter should be: −5.04289, 1.93965, 0.10478

Now, here's a screenshot of my results:


and a side by side comparison. Target results in red, my results in blue.

Mean Anomaly: 141.324° | 141.365°
True Anomaly: 144.637° | 144.036°
r: 5.40406 | 5.40417
x: −5.04289 | -5.04431
y: 1.93965 | 1.93624
z: 0.10478 | 0.104829

Pretty close! I'm very happy with how the calculations are working. 

The second part of what I was working on this week was importing a basic model from 3Ds Max and getting it displayed on screen. This proved quite difficult! The code I was planning to use from last semester proved instantly unusable - it requires models to be of .txt format, and 3Ds Max does not export to this format.

I spent many hours trying and testing different loaders, and eventually settled on an object loader (it loads models of type .obj) called GLM from this website: http://www.3dcodingtutorial.com/Working-with-3D-models/Getting-GLM.html. I imported the files into my project and put them in a seperate folder - this means that the ImportModel and point classes I had made are no longer needed. 

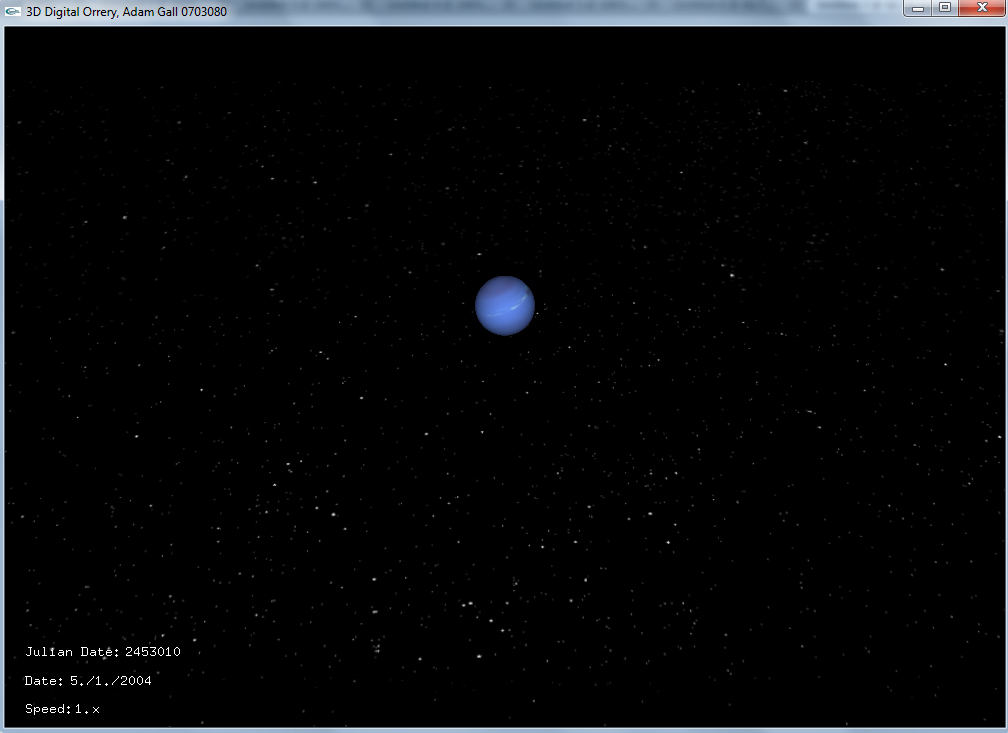
With a bit of tweaking, I've managed to get a geosphere with a material of an alien's face that I created in 3Ds Max, to display in my viewport window. Here's a screenshot:


All in all, some good progress made. 

More next week.